Studio
Studio is where you describe what you want to see and Manifest builds it: a dashboard of widgets you keep, or a report of assets you export. One prompt bar, two outputs.
- For
- Describe what you want to see and Manifest builds a dashboard of widgets or a report of assets.
- Will not
- Drilling from a chart is only offered for group-by fields the Assets screen can land on: the status chips and keyword-searchable columns. Other dimensions stay hover-only, so a click never lies about where it goes.
- Writes
- Saves dashboards and saved reports (which store the prompt, not the result); the page does not say whether these are attributed or audited.
What you are looking at
Studio replaces the separate Dashboards and Reports sections. It is one screen with a toggle at the top, because the question you are asking is the same either way; only the shape of the answer changes.
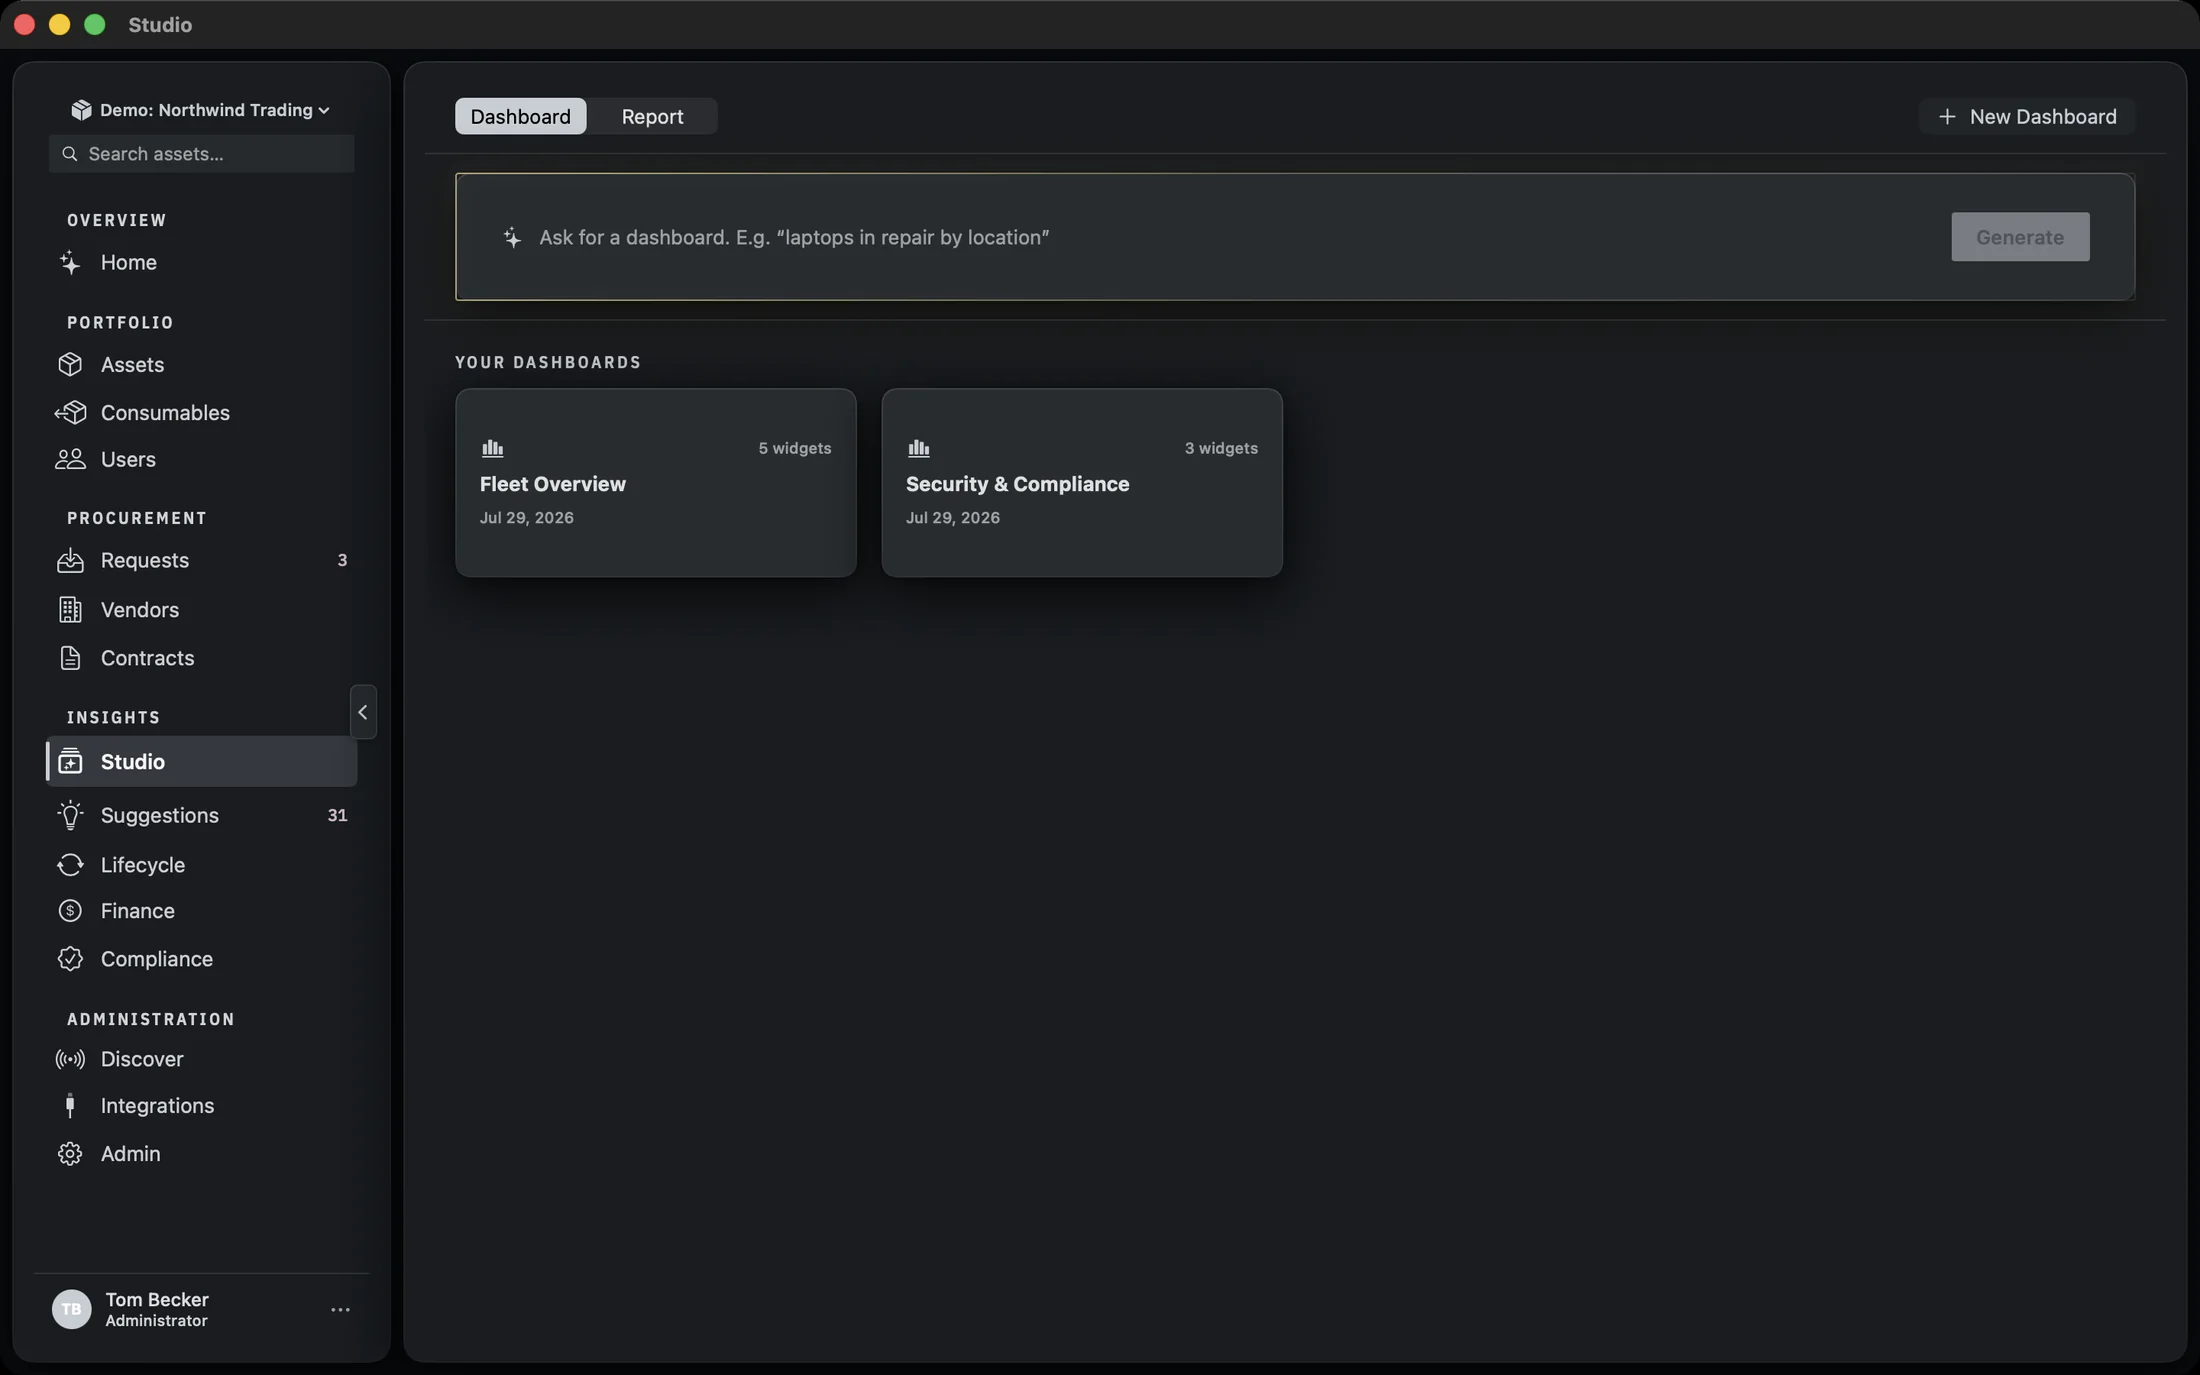
The top row is the output toggle, Dashboard and Report, and the actions for whichever one is selected. Under it sits the prompt bar, and under that the content: the dashboard library, an open dashboard, or a report table.
The prompt bar changes its placeholder text with the toggle. On Dashboard it reads Ask for a dashboard. E.g. “laptops in repair by location”; on Report it reads Ask for a report. E.g. “assets overdue for verification”. Press Return or click Generate to run it.
Building a dashboard
A dashboard is a saved, editable set of widgets. You describe the whole thing in one sentence and Manifest proposes the widgets, then you adjust them.
With Dashboard selected and no dashboards yet, the screen shows a hero: Ask for a dashboard, with the line Describe what you want to see, “assets in repair by site”, “spend by vendor”, and Manifest builds it. Under it are three example prompts you can click instead of typing: Assets by status, Assets by location and Spend by vendor.
Type your own or click one of those, and the prompt bar shows a spinner while it works. When it finishes, the new dashboard opens with its widgets laid out in a grid.
The generation banner is worth reading before you trust the result. It reports Built N widgets, and adds N couldn’t be built or N value(s) to confirm when either applies. Dismiss it with the close button on the right.
The planner is deterministic first. A rule-based planner grounded in your registry handles the common ITAM prompts, and the on-device model is only consulted when the rules cannot confidently parse the request. That is why the same prompt tends to produce the same dashboard twice.
The dashboard library
Every dashboard you have is a card. Open one, or start a new one from the same row.
The library is a grid of cards under the heading YOUR DASHBOARDS. Each card shows the dashboard name, the date it was created, and its widget count. Click a card to open it. Right-click for Delete Dashboard.
New Dashboard is always in the top right, whether you are in the library or already viewing one. It asks for a name and creates an empty dashboard you can add widgets to by hand.
When you are inside a dashboard, the header changes: All dashboards takes you back to the library, the dashboard name sits next to it, and an overflow menu holds Refresh and Delete Dashboard.
Editing a widget
Every widget has an overflow menu with Edit Widget. The editor is registry-driven: every picker is populated from the fields your organisation actually has.
The sections are Widget (title and type), Data source (which entity to query), then either Measure & grouping or Columns depending on the type, then Trend over time for line and scorecard, Gauge for gauges, and Filters for all of them.
- Group by appears for bar and donut. Break down by appears for bar only, and turns it into a stacked bar with a second dimension.
- Measure is the aggregate, and Of is the field it applies to. Count needs no field; distinct count works on any field.
- Trend over time restricts the group-by to date fields and adds a Bucket by picker: Day, Week, Month, Quarter or Year.
- Gauge takes comma-separated Band edges (for example
50, 80) and a toggle for Value is a percentage (0–100). Below the first edge shows red, the top band green, the middle amber. - Filters is a list of field, condition and value rows. Add one with Add filter; remove one with the row’s delete.
Add Widget or Save compiles the draft and validates it. If the combination is not valid, the footer shows the reason in place of the buttons: Pick one group-by field and one measure., A trend needs a date field and a time bucket., Pick at least one column., and so on.
Reading a widget
Each widget kind draws its result a different way, and some of them are clickable.
A Number is a single large figure. A Gauge is a dial with the same figure, tinted by the bands you set. A Scorecard shows the latest period’s value, its change against the previous period, and a sparkline. A Line is an area-filled trend across time buckets.
A Bar or Donut draws categories. Hovering a bar or a legend row shows a tooltip with the label and value; when the category can be drilled into, the tooltip adds Click to view and clicking opens the Assets screen already filtered to those records.
Drilling is only offered for group-by fields the Assets screen can actually land on: the status chips, and the keyword-searchable columns (make, model, location, assigned user, tag, serial). Other dimensions stay hover-only, so a click never lies about where it goes.
A Table widget draws its columns and rows in a scrollable grid. When a widget’s query hit the row cap, the header shows capped with the note Results were truncated at the row cap. Add a filter to narrow them.
Building a report
Switch the toggle to Report and the same prompt bar builds a table instead of a dashboard. A report is not saved until you say so.
With Report selected and nothing built yet, the screen shows Ask for a report, with the line Describe the assets you need, “unassigned laptops”, “leases ending soon”, and export the table as CSV. Four example prompts sit under it: Unassigned laptops, In repair, Overdue verification and Leases ending soon.
Type a prompt or click one, and Manifest parses it into a filtered asset list. The table has five columns: Asset Tag, Model, User, Location and Status. A blank cell shows an em dash.
When the report is built, the header shows the count (12 assets), a Save button and an Export CSV button. Export CSV opens a save panel with the prompt as the suggested filename, sanitised to lowercase with hyphens.
If the prompt matched nothing, the screen says No matching assets with the line Nothing matched “your prompt”. If the parse failed outright, it says Couldn’t build report with the reason.
Saved reports
A report you run often can be saved by name and re-run from a menu. Saving stores the prompt, not the result.
Save in the report header stores the current prompt under the name you gave it. Saved reports appear in two places: a Saved menu in the header, and a SAVED REPORTS list on the empty state.
Clicking a saved report re-runs its prompt and shows the result. The trash icon next to a saved report deletes it. Because a saved report stores the prompt rather than the rows, running it always reflects the register as it is now.
Where prompts come from
Studio is not the only place a prompt can start. Two other screens route one in.
The Home command bar and the Assets search can both hand a prompt to the Studio. When they do, the Studio opens with the prompt already running, and the output toggle is set to whichever one the caller asked for.
From Assets, Dashboard from this view and Report from this view both send the current filter described in words. You are not rebuilding the filter at the other end.