Finance
Finance is what the fleet costs: the monthly and annual run-rate, the split between OpEx and CapEx, every recurring commitment, and a forward projection. It reads the register; it does not write to it.
- For
- Shows the fleet’s run-rate, its OpEx and CapEx split, recurring commitments and a 24-month projection.
- Will not
- It reads the register and does not write to it. Owned devices with no purchase price, useful life or date count as zero, so the run-rate is understated rather than guessed.
Five panes, one number
The segmented control at the top switches between Overview, Spend, Leases, Forecast and Reports. They are five views of the same run-rate, not five separate calculations.
Everything on these panes comes from the deterministic FinanceEngine, which reads the assets and consumables you have already entered. Nothing here is estimated beyond the stated assumptions, and nothing is fetched from a market feed. The figures use your entered prices and rents.
Forecast is the CapEx planner, and it lives here as a pane rather than as its own area so that everything about money sits in one place.
What the run-rate is made of
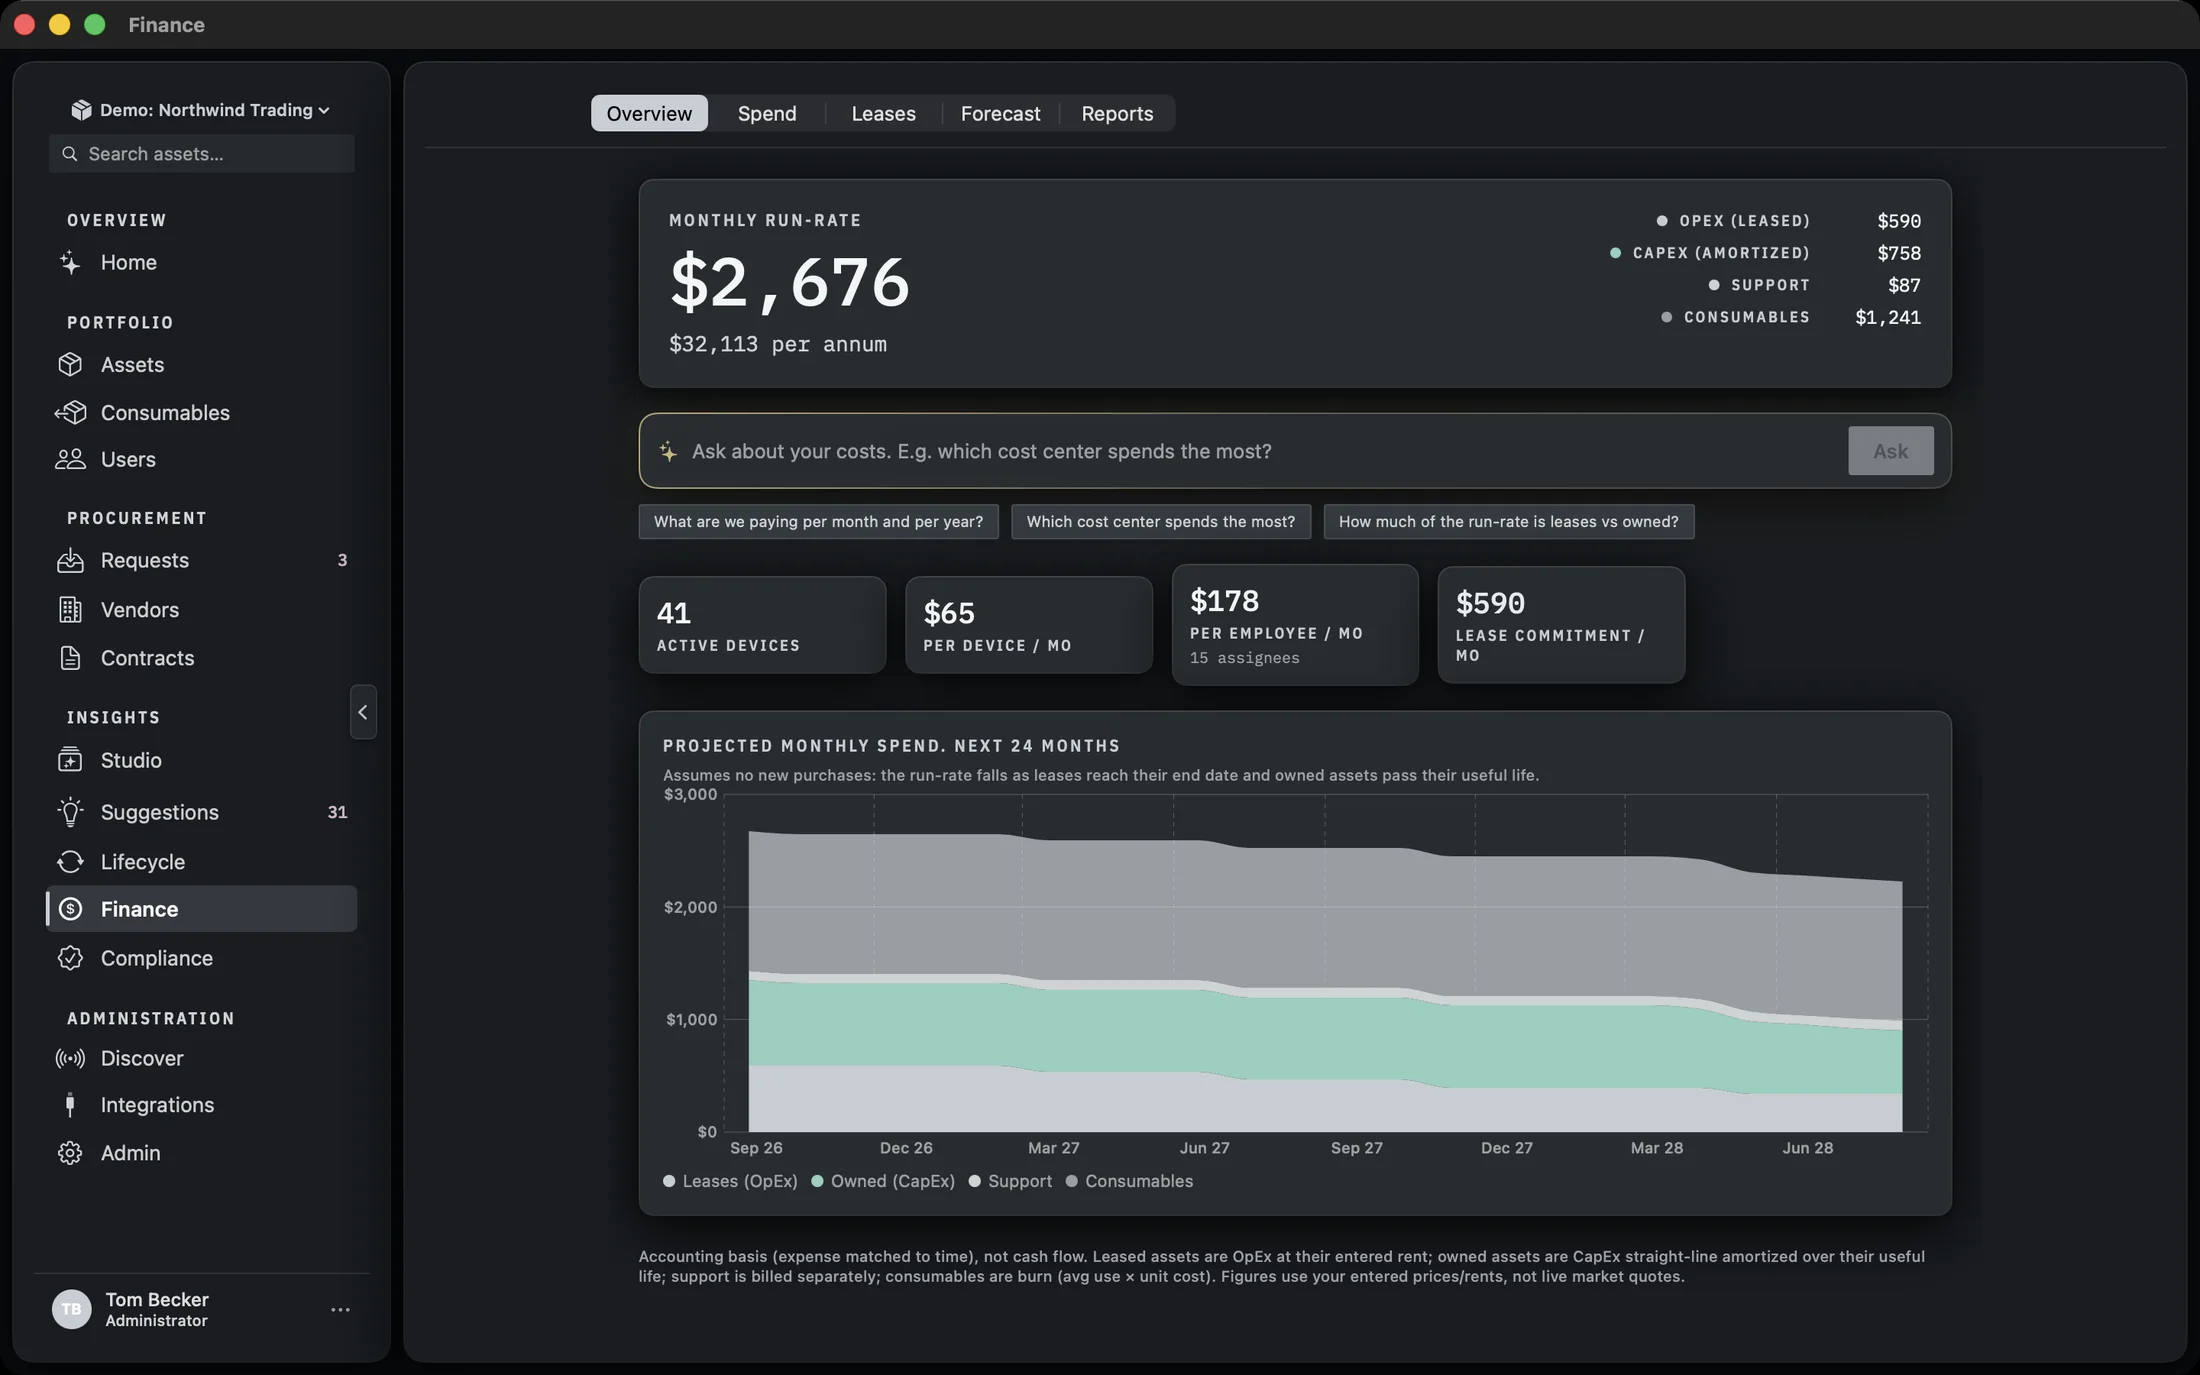
Four categories, in the same order everywhere they appear: the split badge, the projection legend, the chart scale.
- Leases (OpEx) at the entered rent, monthly-equivalent.
- Owned (CapEx), straight-line amortised over each asset’s useful life.
- Support, billed separately.
- Consumables, burn: average monthly use multiplied by unit cost.
The basis is accounting, not cash flow: expense matched to time. That is why a leased machine contributes its rent each month rather than its total contract value, and why an owned machine contributes a slice of its purchase price rather than the whole of it in the month it arrived.
Consumables are drawn in a pale tint, not the app’s alarm colour. Routine spend is not a fault, and a chart that paints the largest band in warning ink makes it read as one.
How an owned asset depreciates
Straight-line depreciation, one schedule per asset, and this is the whole of it. There is no declining balance, no half-year convention, and no other method to choose. The screen calls it amortisation, which is the same arithmetic.
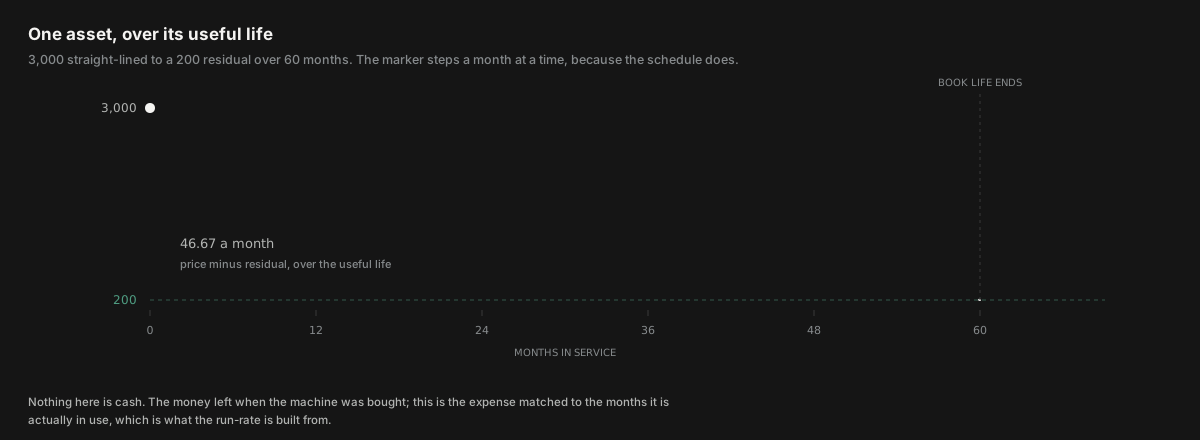
Each month, an owned asset contributes its purchase price minus its residual value, divided by its useful life in months. That figure is added up across the fleet to make the CapEx (amortized) row in the split, and it is the same number behind the Spend pane, the projection and the answers the Ask bar gives.
It is also the schedule behind the Book Value card on each asset’s own record, and the Book Value column in the Assets table. One asset, one book value, whichever screen you read it from.
Four things have to be on the record before an asset contributes anything:
- Finance Treatment set to CapEx (owned). It defaults from the acquisition type, so a purchased asset is CapEx and a leased one is OpEx, and you only change it for a case like a lease you bought out.
- Purchase Price. Without it the asset amortises at zero.
- Useful Life (months). This is per asset. There is no policy table and no organisation-wide default, because the same figure also drives the refresh forecast and the runway, and one number per asset is easier to defend to an auditor than a rule nobody can see.
- A date to run the schedule from: Purchase Date, or Install Date if there is no purchase date.
Residual Value is optional and treated as zero when it is blank. Set it when you expect the machine to be worth something at the end of its life, and the asset depreciates down to that figure instead of to nothing.
Which months count
A full-month convention, at both ends.
An asset depreciates in the month it was acquired, not from the month after. Counting only whole elapsed months would skip the acquisition month entirely, and a fleet bought in one quarter would show a quarter of nothing.
It stops the month it has run its useful life. A fully depreciated machine contributes zero from then on rather than going negative or carrying on, which is why the projection tapers as older hardware falls off it. An asset dated in the future contributes nothing until its month arrives.
Disposing of or decommissioning an asset takes it out of the run-rate altogether, in the month you do it. The record and its history stay; the cost stops.
None of this is cash. The money left when the machine was bought. Depreciation is the accounting basis, which spreads that expense across the months the machine is actually in use, so the run-rate answers what the fleet costs to run rather than what left the bank this month. For cash, read the Leases schedule and the Forecast.
A worked example
One laptop, so the arithmetic is visible.
A laptop bought for 3,000 on 1 September, with a useful life of 60 months and a residual value of 200. The depreciable amount is 2,800, so it contributes 46.67 a month. September is the first month it counts, and the sixtieth month is the last. After that it contributes zero and the fleet’s run-rate drops by 46.67 without anybody touching the register.
Leave the residual value blank and the same laptop contributes 50.00 a month instead, depreciating the full 3,000. Put the 200 back and shorten the useful life to 36 months, and it contributes 77.78. The useful life is the figure that moves the number most, which is why it is entered per asset rather than assumed.
Asking about your costs
The Ask bar sits under the hero on Overview. It answers questions about the run-rate, and it tells you which engine answered.
Type a question and press Ask, or click one of the three example chips: What are we paying per month and per year?, Which cost center spends the most?, How much of the run-rate is leases vs owned?. The answer appears in a card with the question above it and a dismiss button on the right.
Either way the figures come from the same engine that draws the chart. The model phrases the answer; it does not invent numbers. The grounding line says so, and it also says that the figures use entered prices and rents rather than market quotes.
Unit economics
Four tiles under the Ask bar, each one a number an approver asks for.
- active devices: the count of assets the run-rate is spread over.
- per device / mo: the run-rate divided by that count.
- per employee / mo, with the assignee count underneath.
- lease commitment / mo: the same total the Leases pane shows at the top.
The 24-month projection
A stacked area chart of the next 24 months, assuming no new purchases.
The chart is titled Projected monthly spend. Next 24 months, and the line under it states the assumption plainly: the run-rate falls as leases reach their end date and owned assets pass their useful life. Bands are stacked by the same four categories, and the legend sits at the bottom.
The x-axis ticks every three months, labelled with the abbreviated month and a two-digit year. The y-axis is on the left, in whole currency units.
When the numbers are understated
Two warnings appear under the projection, and both of them mean the run-rate is lower than it should be.
If owned devices have no purchase price, their CapEx amortisation counts as zero and the run-rate is understated. The warning says how many devices are affected. If priced devices have no purchase or install date, there is no schedule to amortise against, so they also count as zero rather than a guessed figure. Add a date to include them.
Zero is the deliberate choice in both cases. A guessed figure would make the run-rate look complete when it is not, and the warning is easier to act on than a number nobody can trace.
The accounting basis footnote sits under those warnings: expense matched to time, not cash flow; leased assets at their entered rent; owned assets straight-line amortised over useful life; support billed separately; consumables as burn. Figures use your entered prices and rents, not live market quotes.
Slicing the same total
Spend re-cuts the run-rate three ways. The picker is the only control on the pane.
The picker offers Cost Center, Site and Type. Switching it re-slices the same total, so the Total row does not move. The chart heading changes to match: MONTHLY RUN-RATE BY COST CENTER, and so on.
If nothing has been recorded for the chosen breakdown, the pane says No spend recorded for this breakdown yet. rather than showing an empty chart.
Every recurring commitment
Leases is the schedule: one row per asset with a recurring cost, sorted by monthly-equivalent, highest first.
The schedule columns are Asset, Cost Center, Rent, Monthly and Lease End. Rent is the figure as billed, quoted for its period: a monthly rent reads $X / month, and a rent on another billing cycle reads $X / quarter or whatever the cycle is. Monthly is the normalised equivalent, so a quarterly rent shows a third of itself there.
Clicking a row opens that asset’s record. The footnote under the table is worth reading once: the monthly-equivalent is the recurring OpEx commitment, not the remaining cash to lease end. Replacement CapEx is on the Forecast pane.
The renew-or-return window
Anything ending within 90 days is called out above the schedule, in the app's warning ink.
The card is headed Ending within 90 days, renew or return, and each row shows the asset, its make and model, the end date, and the monthly-equivalent. Rows are sorted by end date, soonest first, and clicking one opens the asset.
Only live commitments appear: an asset whose lease has already ended is not a commitment, so it drops off the schedule and the total. That is why the monthly commitment here matches the OpEx figure on Overview.
If nothing has a recurring cost yet, the pane says No recurring commitments and points you at the Finance section of an asset record, which is where a lease rent or subscription is set.
Exports
Reports is five one-click CSVs, each built from the same engine that drew the panes.
- Executive TCO Summary: monthly and annual run-rate with the OpEx/CapEx/support/consumable split and unit economics.
- Spend by Cost Center, Spend by Site and Spend by Device Type: the same slices the Spend pane draws, with OpEx and CapEx split out.
- Lease Commitment Schedule: every recurring asset with rent, billing cycle, monthly-equivalent and lease end.
The numbers in the file are the numbers on screen. There is no separate export path that could drift from the pane.