Lifecycle
Lifecycle is the fleet seen as a pipeline: how many machines sit in each phase from procure to dispose, which ones have stalled, and what is behind any phase you click.
- For
- Shows how many assets sit in each lifecycle phase, what has stalled, and the assets behind a selected phase.
- Will not
- It does not edit anything: selecting a phase only opens a list, and the only way to change a machine is to follow Open in Assets.
What the screen is for
Lifecycle answers one question: where is everything, and is anything stuck. It reads the register, it does not write to it.
The page is a stack of cards, top to bottom: a Manifest summary, the composition of the fleet, the pipeline of phases, a Needs attention grid when there is anything to flag, and the asset list for whichever phase you have selected. Nothing here edits an asset. Selecting a phase is the only interaction, and it opens a list rather than a form.
Every number on the page is computed from the register. Manifest narrates those numbers, it does not produce them.
The Manifest summary
A short paragraph at the top of the page, written from the same numbers the rest of the screen is drawn from.
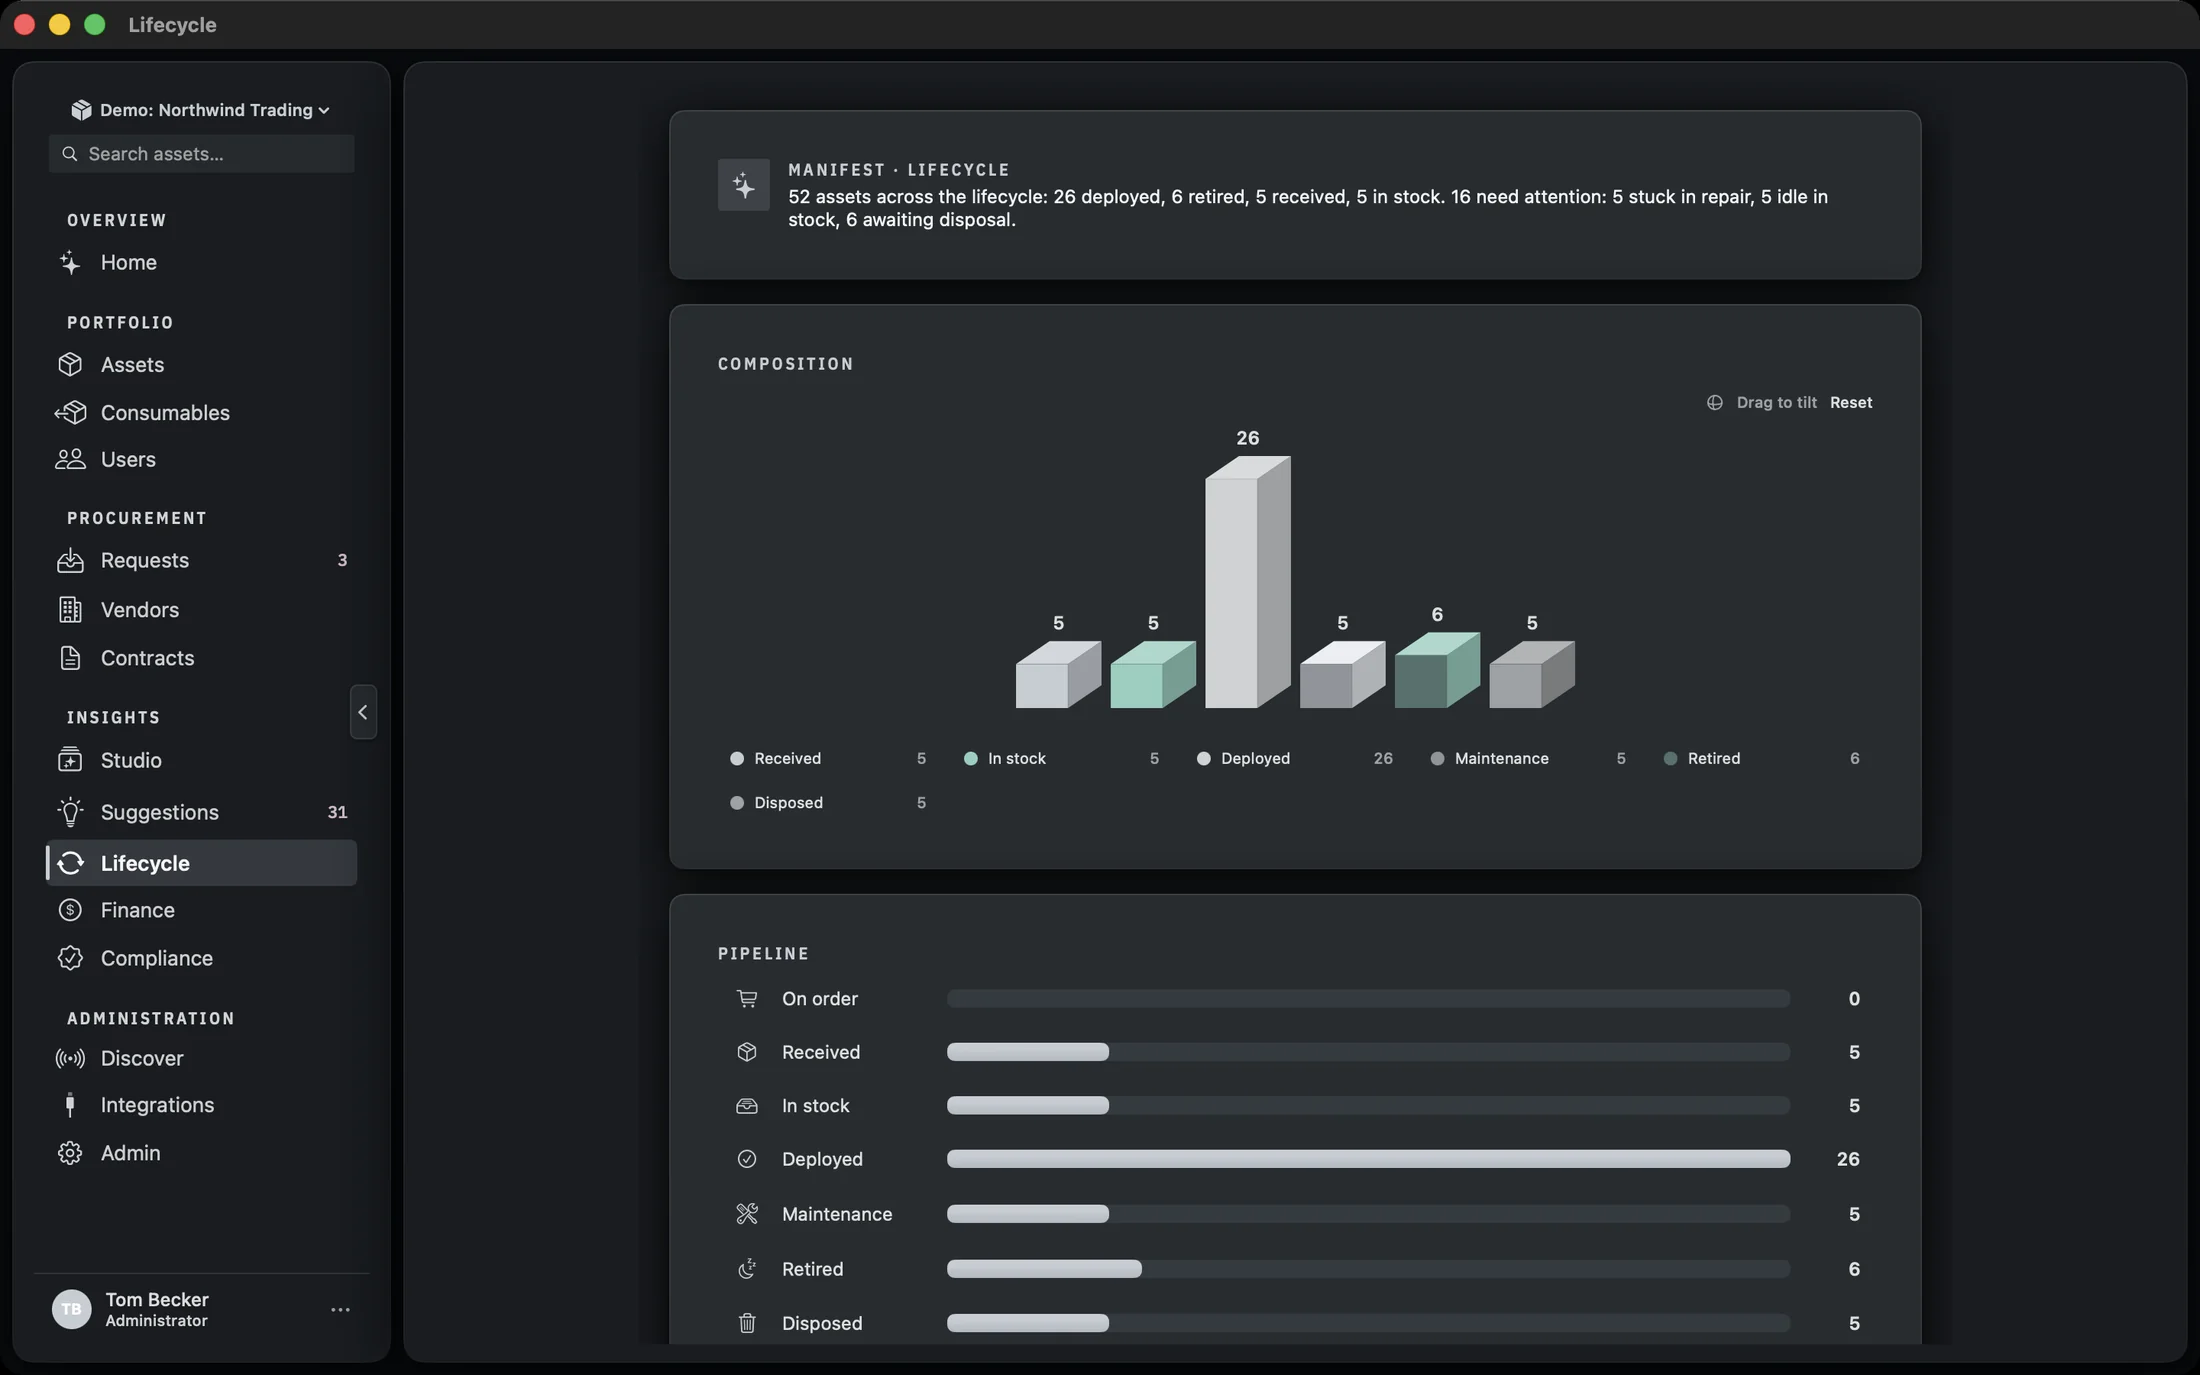
Read it as a caption for the rest of the screen rather than a separate report. If the numbers below change, the sentence changes with them.
Composition
The same phases as the pipeline, drawn as a chart. On macOS 26 it is a row of extruded 3D blocks; on earlier versions it is a donut.
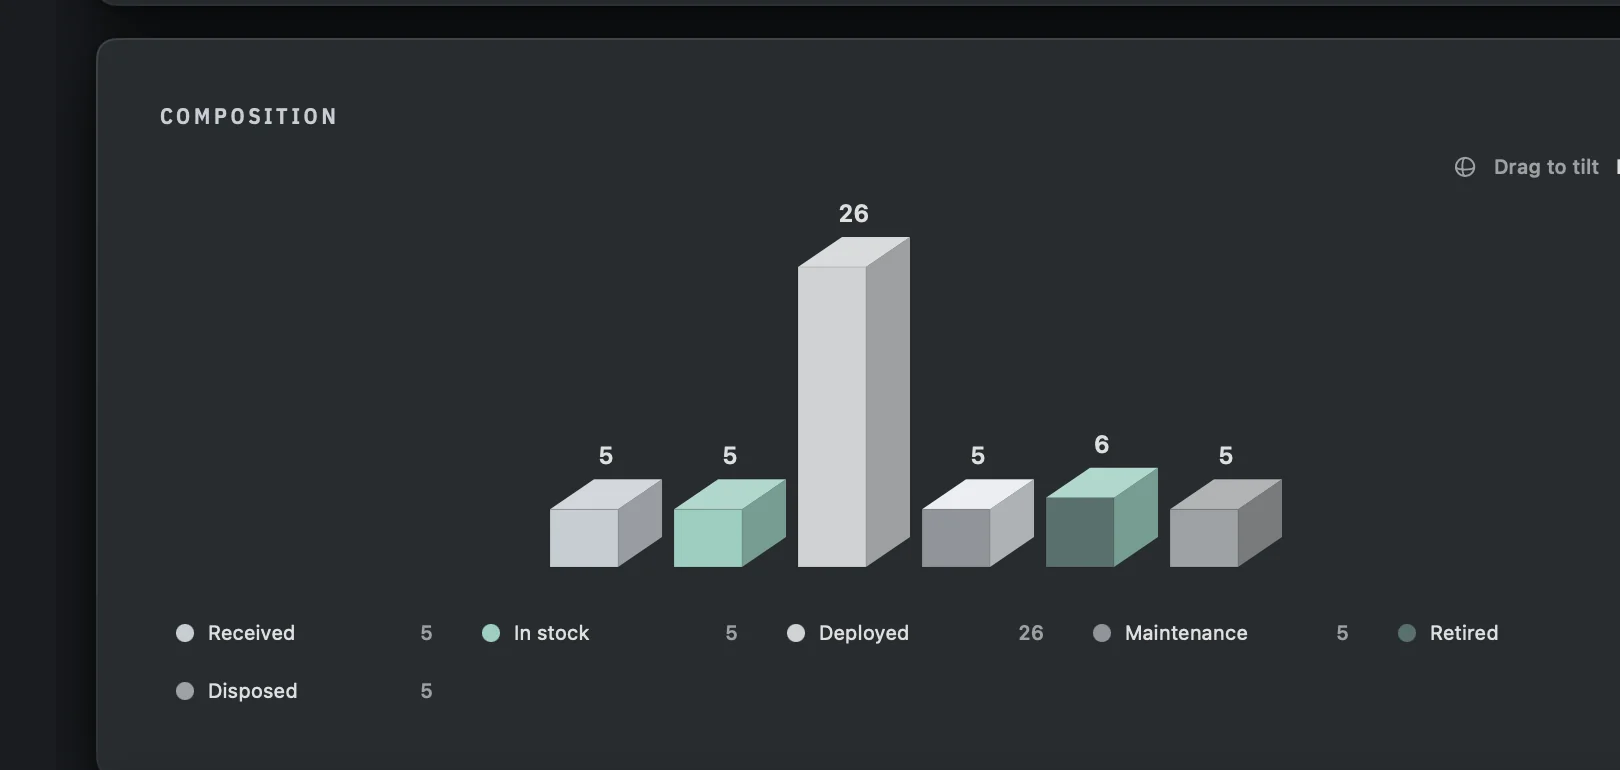
Drag anywhere on the chart to tilt the whole scene, which changes the depth of the blocks rather than the data. Reset returns the tilt to its default. Clicking a block, or its entry in the legend, selects that phase: the block lifts, the others dim, and the asset list for the phase appears further down the page. Clicking the same phase again clears the selection.
The 3D chart is hand-built rather than drawn by a charting engine, so it renders on every macOS version Manifest supports. On macOS versions where the 3D chart is not available, the same data is drawn as a donut with a legend beside it, and the interaction is the same: click a slice or a legend row to select the phase.
Pipeline
One bar per phase, in order, with the exception row separated at the bottom when there is anything in it.
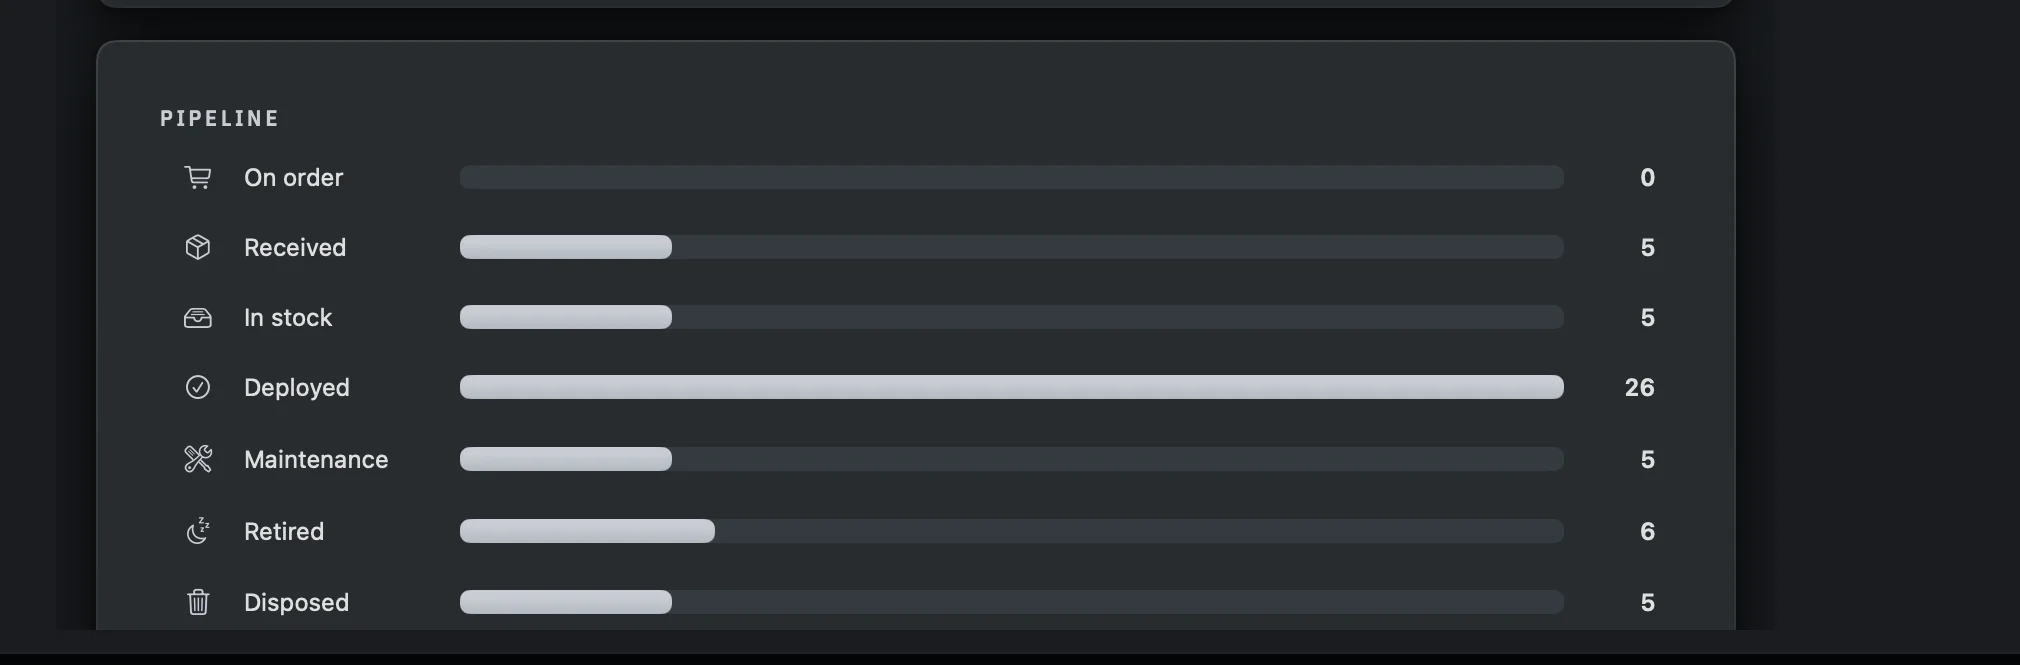
The exception row sits below a divider and only appears when it has assets. It uses the same layout as the phases but is drawn in a different colour, because it is not a phase: it is the bucket for assets whose status does not map to one.
Clicking a row selects that phase, exactly as clicking a block in the composition does. The two stay in step: selecting in one highlights the other.
Needs attention
A grid of cards, one per thing worth looking at, shown only when there is something to show.
The section is absent when there is nothing to flag, so an empty page is a good sign rather than a missing feature. When it is present, each card is a count and a short explanation of what the count is.
If any of the flagged assets have an estimated time in phase rather than a recorded one, a line appears under the grid explaining how many, and why: those assets have no status change recorded yet, so the time is measured from the last edit. Each becomes exact at its next status change.
The assets in a phase
Select a phase and a list appears below the pipeline, showing the assets in it, longest in phase first.
The list is sorted by how long each asset has been in the phase, longest first, so the top of the list is the thing most worth looking at. The time is shown as a number of days, or as updated today when the asset has not moved since it was last edited.
For phases that map to a filter chip in Assets, an Open in Assets link appears in the heading. It takes you to the Assets table with that chip already applied, so you can act on the list rather than just read it. Phases without a direct chip do not show the link.
Selecting a phase does not change any asset. Lifecycle is a read of the register, and the only way to change a machine from here is to follow Open in Assets and edit it there.
What the numbers mean
Two things worth knowing before you read the page as a report.
- Phases come from status. An asset is in a phase because of its status, not because of anything set on this screen. Change the status and the pipeline moves.
- Time in phase is measured from the last edit when there is no status change to measure from. The line under Needs attention tells you how many assets are in that position.
Deleted assets are excluded from every count and every list on this page, so the pipeline reflects what you hold rather than what you have ever held.